
The Field Guide
The Data. The Analysis. One Dashboard.
Scroll down to see the analysis KennelEyes shows you — capacity, revenue, payroll, your books, your customers — all in one place.
01 — Capacity
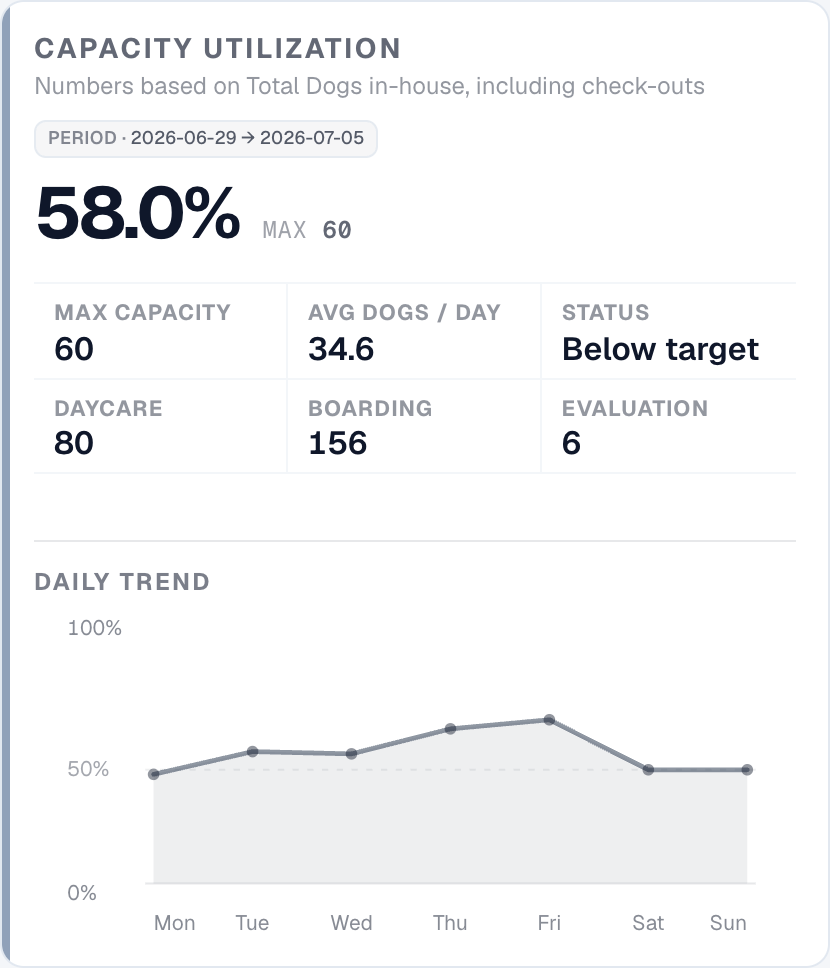
Know how full you are and capacity for growth.
Average dogs in-house compared to your max capacity, with the data split into daycare, boarding, and evaluations — and a daily trend that shows which days carried the week.
- Total dogs for each business line
- Daily occupancy trending
- Set your benchmarks to see if you are meeting goals
02 — Revenue Mix
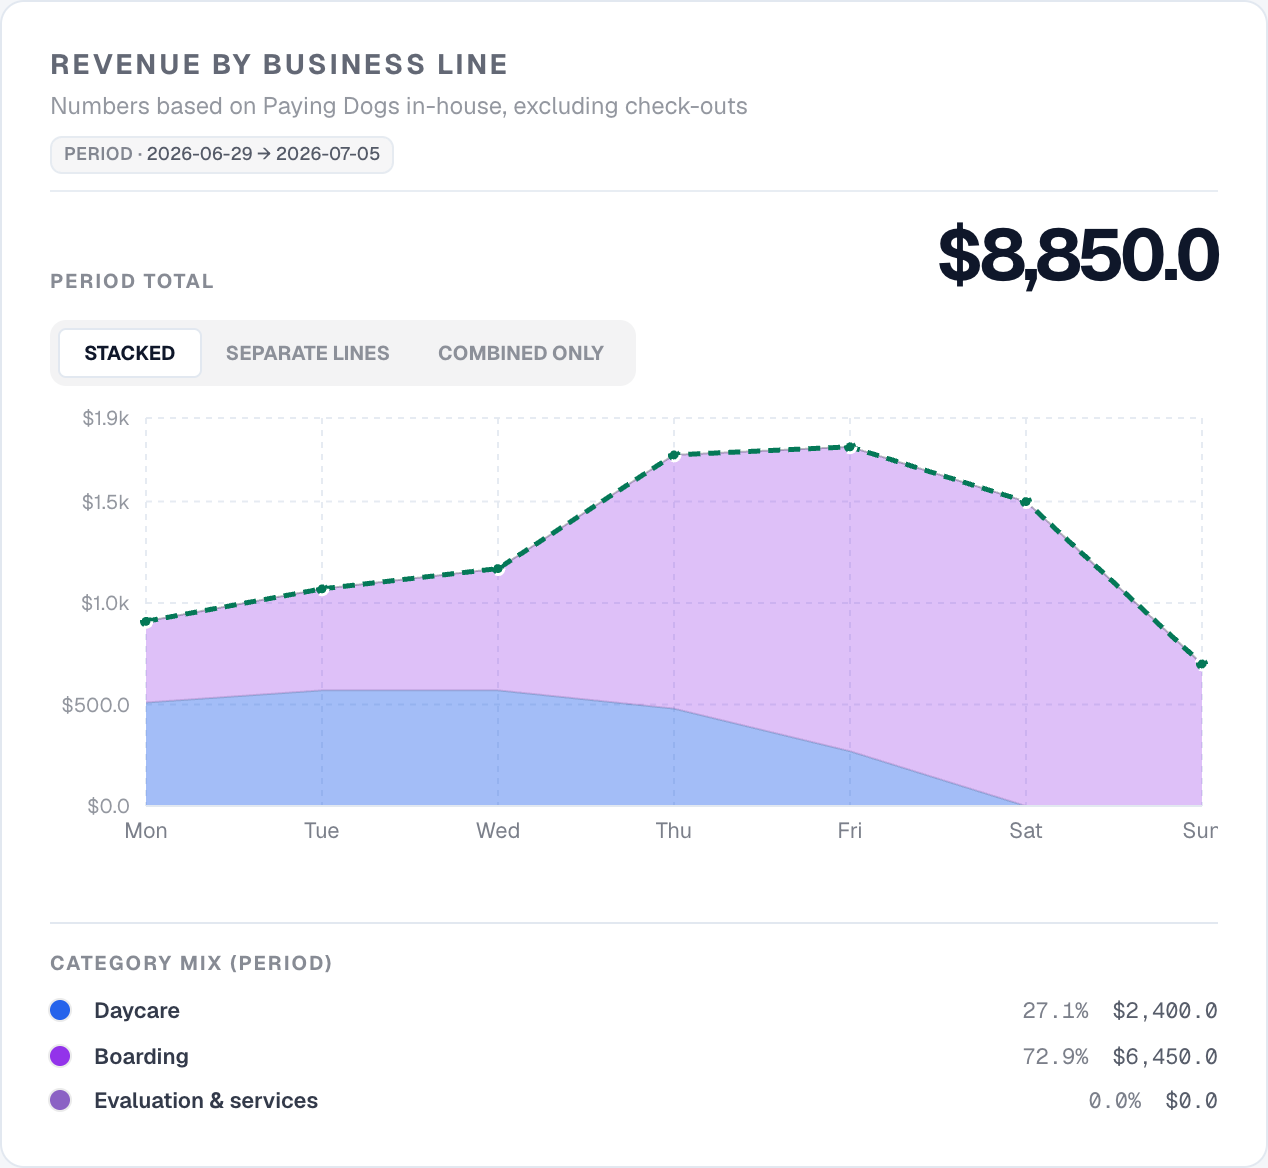
See what's driving your business.
The week's revenue as a stacked visual — daycare vs. boarding — with revenue and percentages laid out below.
- A week leaning 75%+ is a business relying on one engine
- Boarding swelling while daycare thins could be a shift worth catching early
- A toggle to view stacked, separate lines, or combined
03 — Labor Optimization
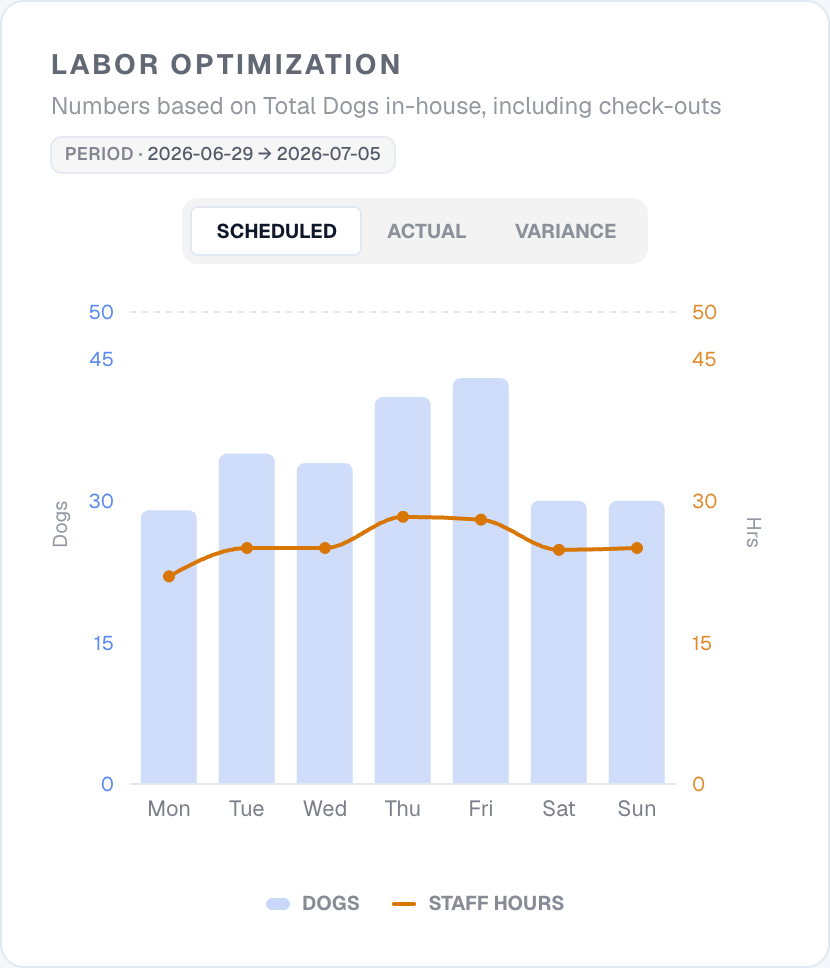
Match the staff to the dogs.
Dogs in-house as bars, staff hours as the line over them — day by day, in scheduled, actual, and variance views. Toggle between scheduled and actual to see how the week played out with staffing.
- A flat hours line means same hours every day despite volume
- The same weekday running a scheduled-vs-actual gap every week
- Variance view shows how staffing was adjusted in real time
04 — Payroll vs. Revenue
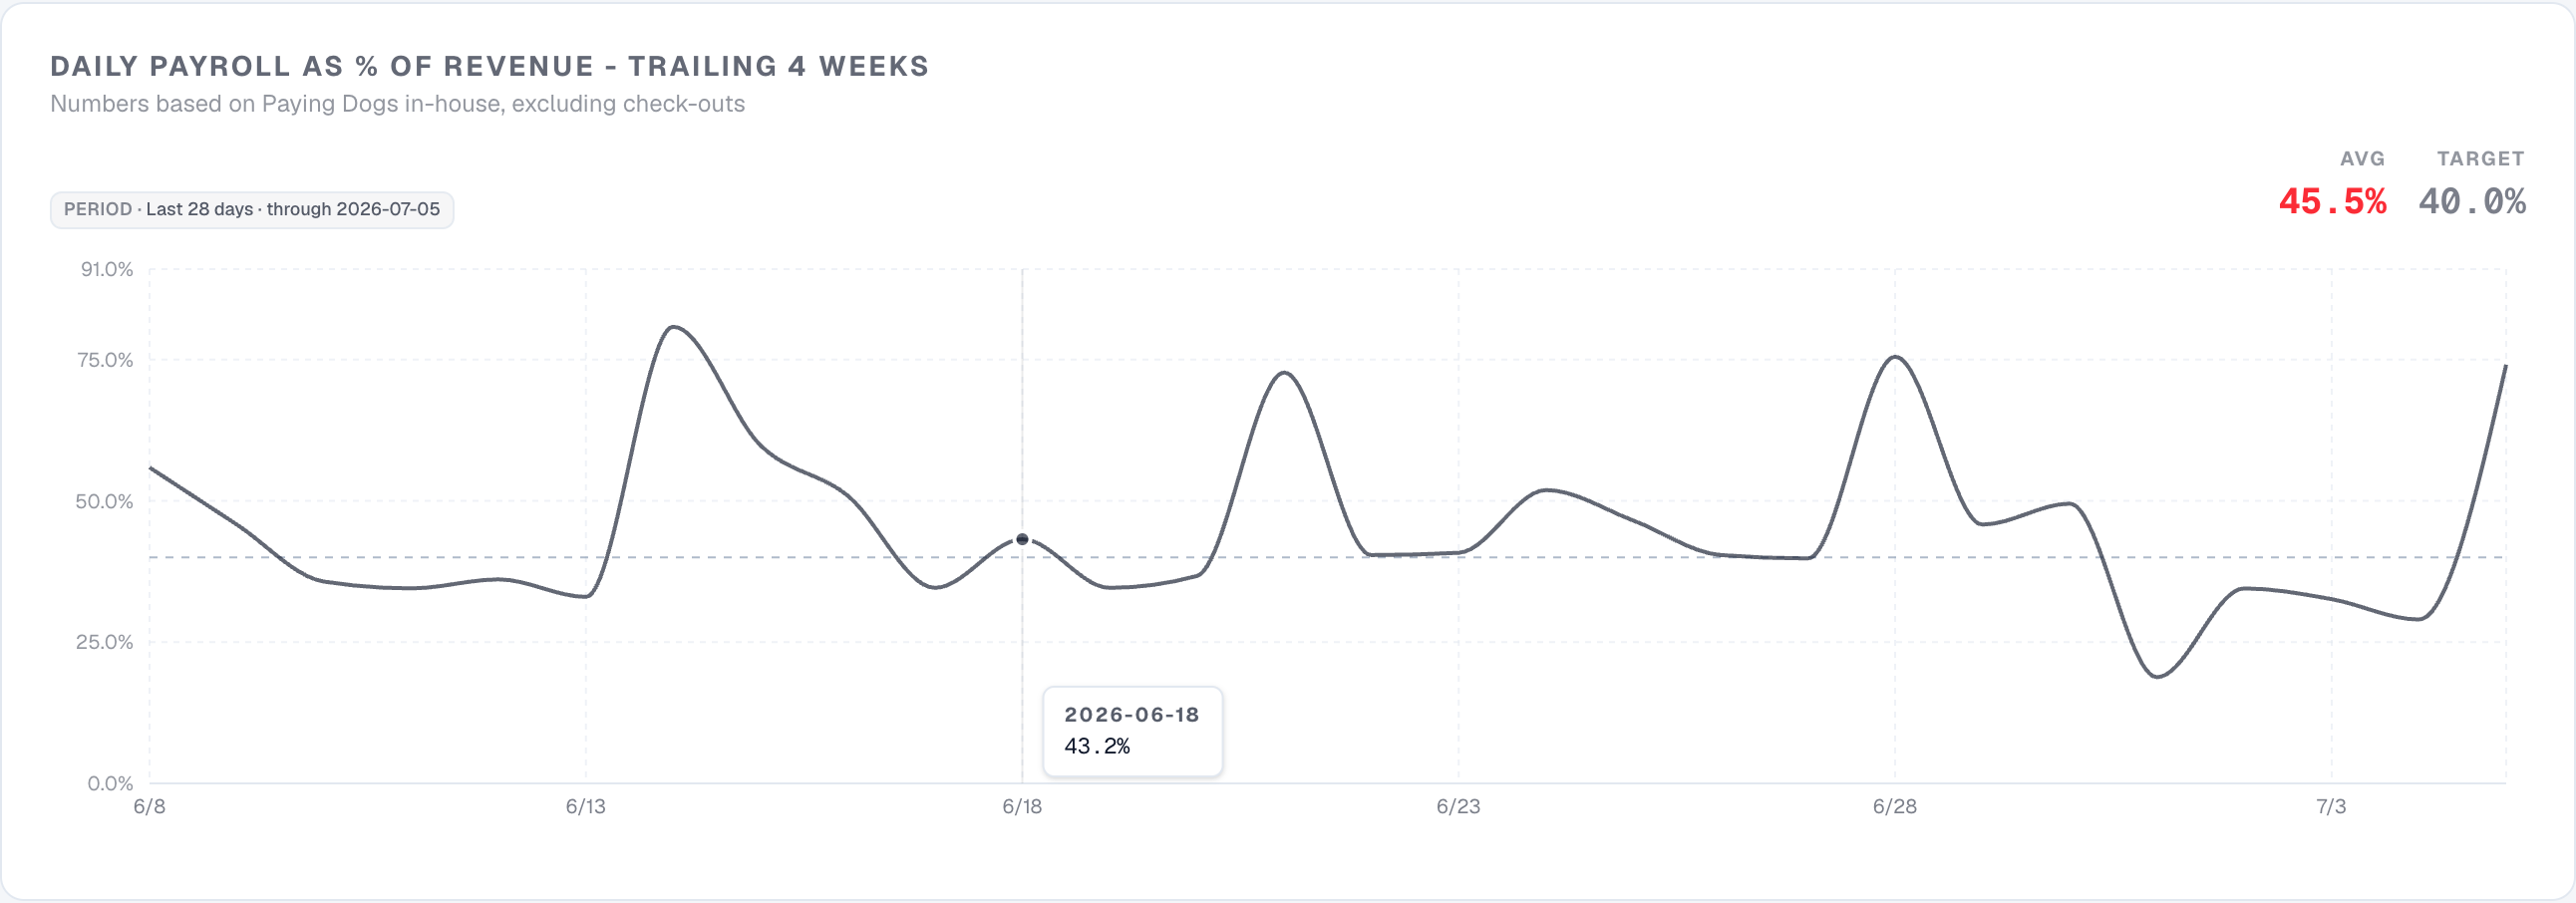
The percentage that decides your profitability.
Daily payroll compared to revenue over time — real hours, real wages, real revenue. Is your average percentage in red? You might be overstaffed.
- Spikes on the same weekday indicate a pattern you can fix
- Climbing payroll under flat occupancy — hours stopped tracking dogs
- A full cycle above target is a staffing conversation, not a data problem
That's where you've been. Now look forward — and make the calls that actually move your numbers.
05 — Reservations Outlook
Fix next week before it happens.
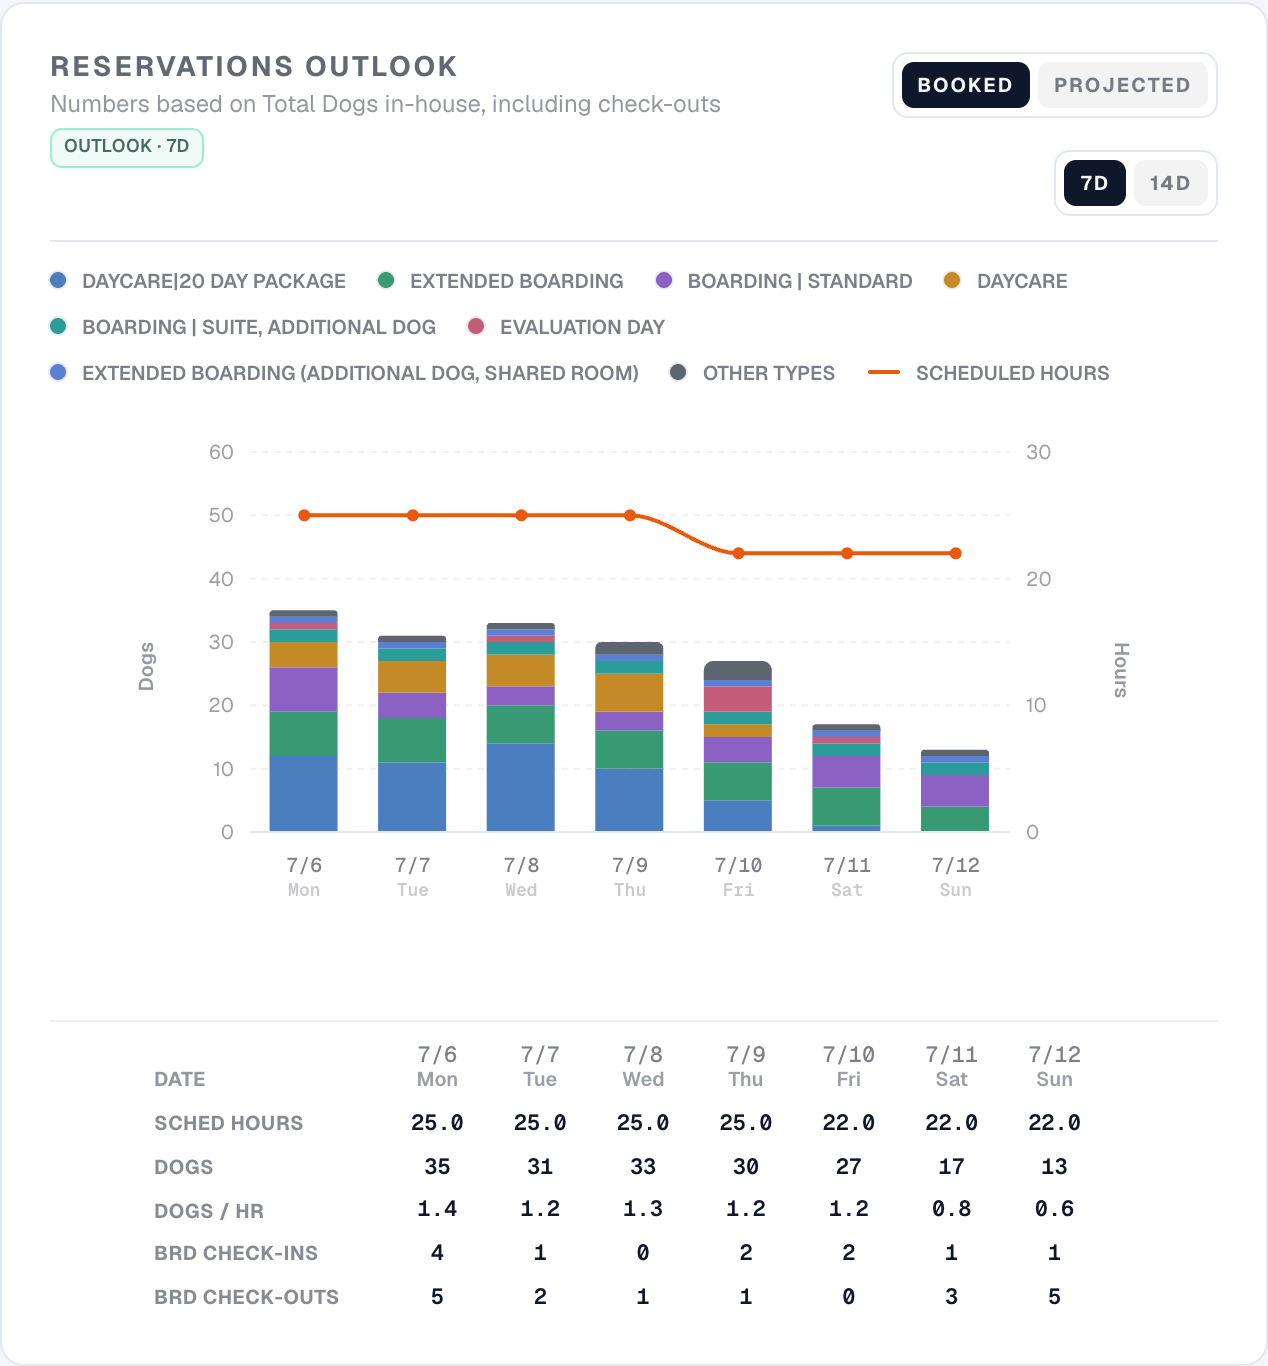
Projected dogs for the next 7 or 14 days, by service line, with the staff hours you've already scheduled — and the per-day math presented below.
- Ability to view actual Booked reservations vs. Projected, based on historical daycare averages
- A flat hours line over falling bars means overstaffing later in the week
- Trim shifts now, or add people ahead of time to avoid a scramble to fill shifts
06 — QuickBooks P&L
Your books, without opening QuickBooks.
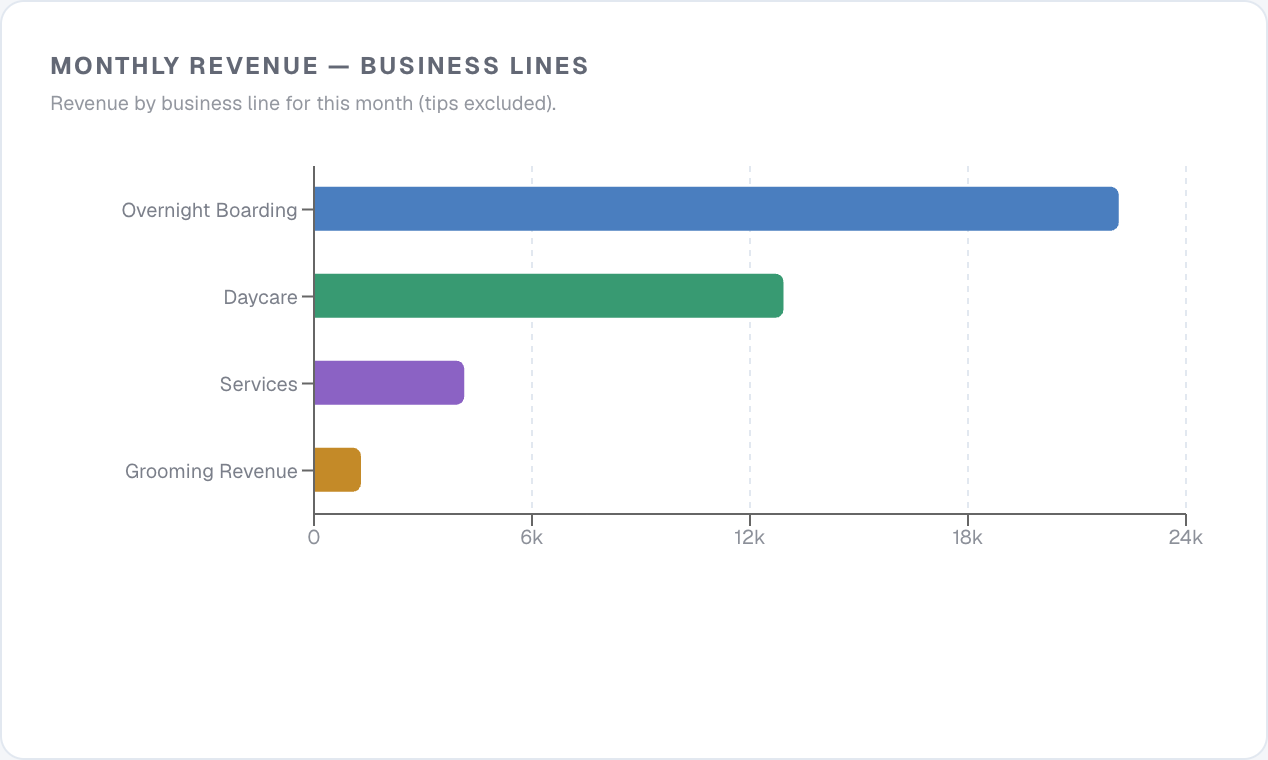
Actual results by month straight from your P&L. The most relevant analysis you don't get from QuickBooks, in the same place as your operational data.
- See what business lines are driving revenue, excluding non-revenue such as tips and sales tax
- Actual payroll results compared to revenue, by month
- Analyze expenses and profitability over time to gauge performance and seasonality
07 — New Customers
Never lose track of a new customer again.
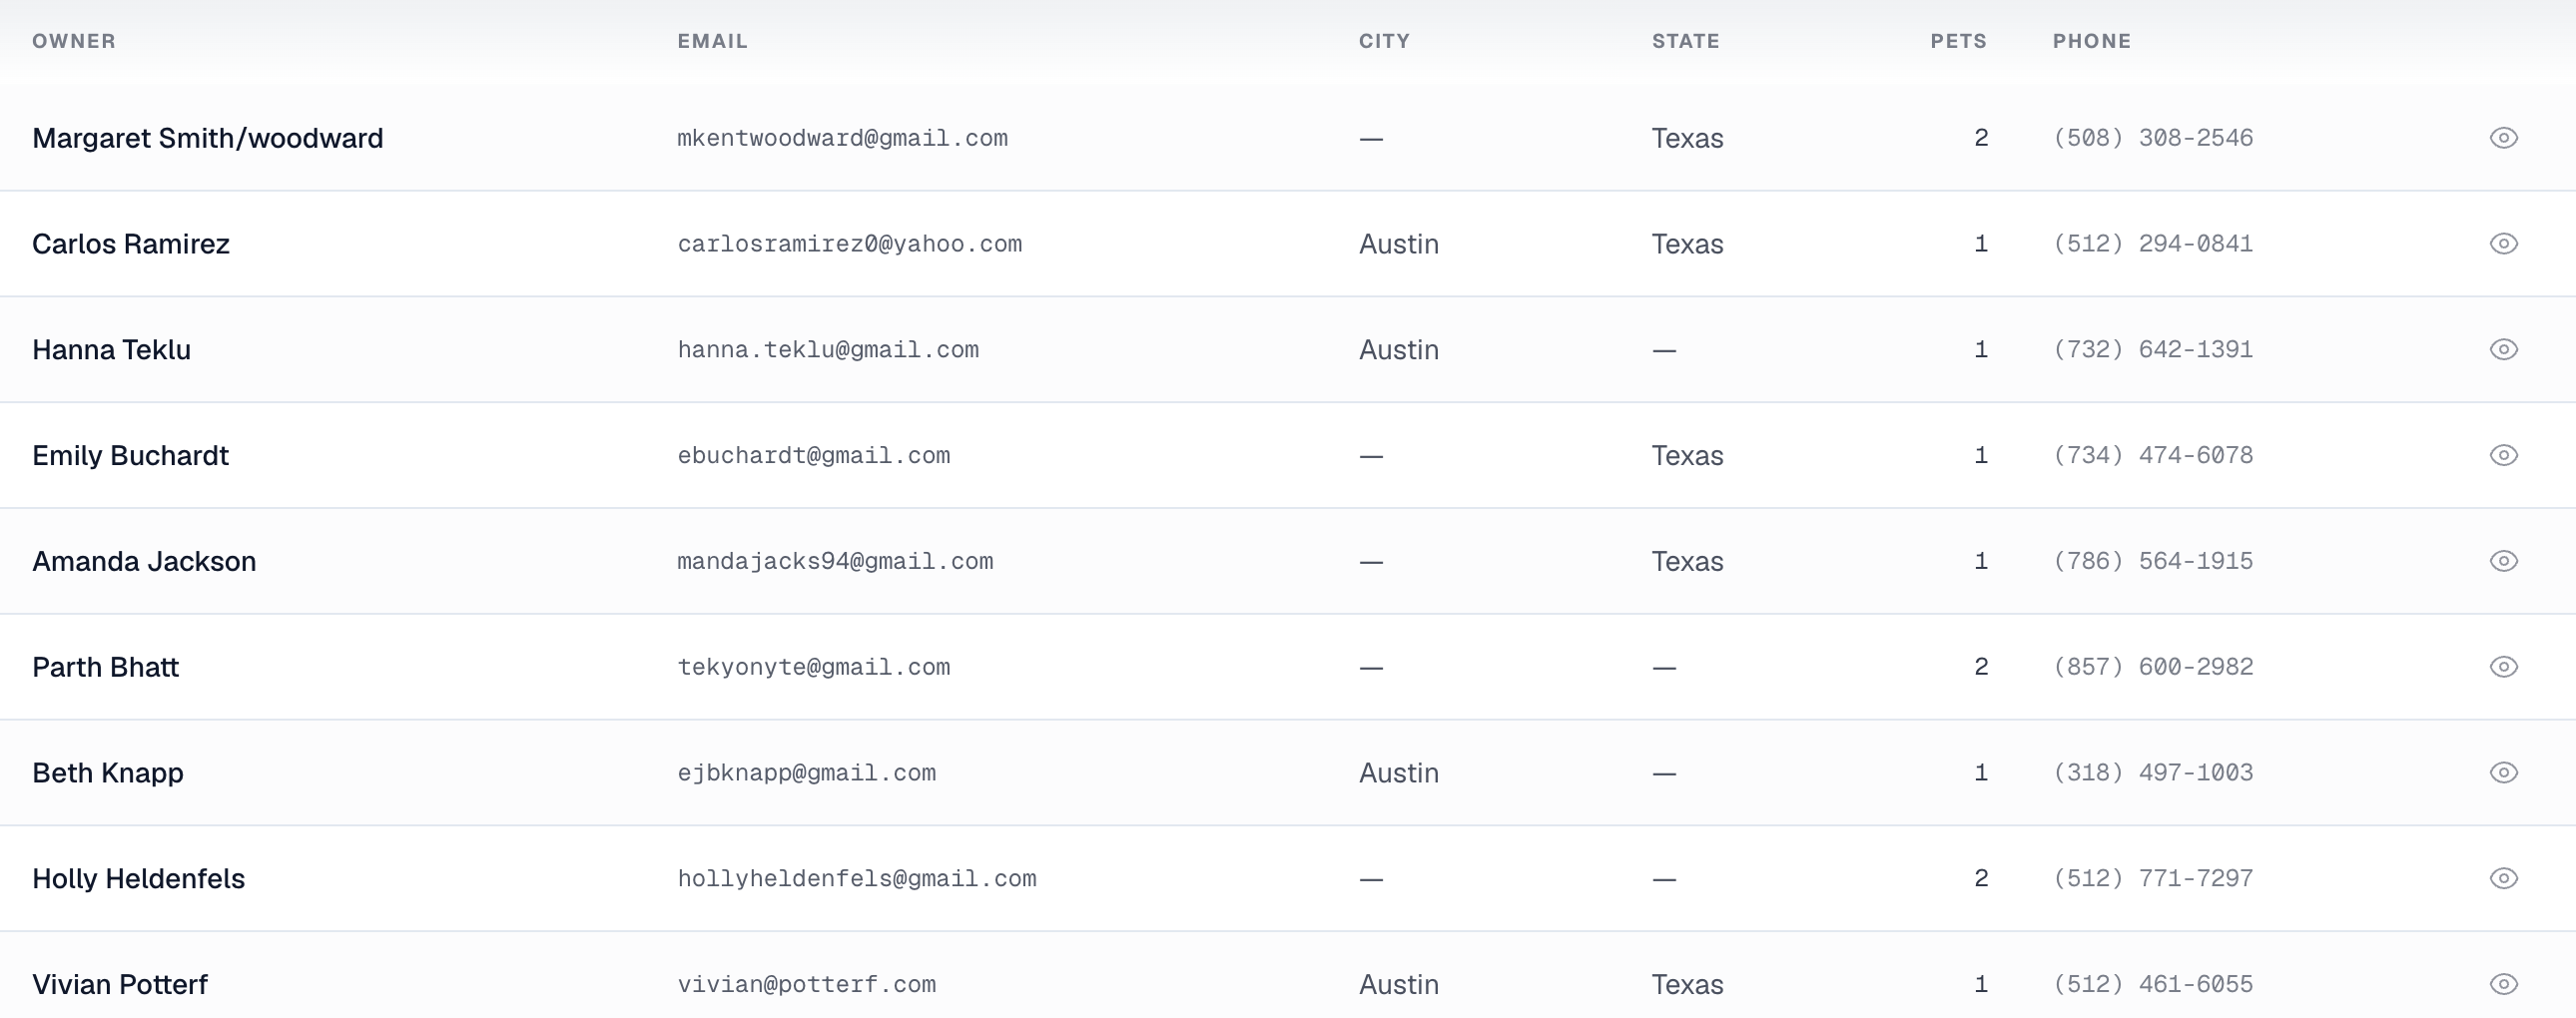
Every new sign-up is tracked — with built-in follow-ups that turn “just looking” into an actual customer for every pup.
- Multiple statuses for the different stages of a new customer
- Notifications for follow-up needed for every person that signs up
- Summary of new customer conversion for each location
That's the highlights. Your numbers next.
The full dashboard goes deeper — occupancy analytics, payroll by position, grooming, training, and more. Thirty minutes, your locations, on screen.